If you spend enough time managing Kubernetes clusters, you will inevitably encounter the infamous CrashLoopBackOff status. It is a rite of passage for every DevOps engineer.
Usually, when a pod enters CrashLoopBackOff, it means the application inside the container is crashing immediately after startup. Kubernetes, trying to be helpful, restarts it. When it crashes again, Kubernetes waits 10 seconds, then 20 seconds, then 40 seconds—backing off exponentially to save CPU cycles.
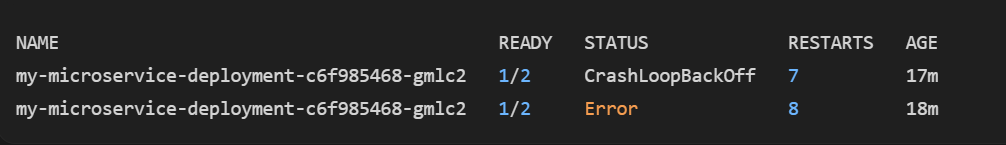
But recently, I ran into a more interesting variation of this problem. A pod in my cluster was stuck in a restart loop, but instead of just showing CrashLoopBackOff, the status began toggling back and forth to Error, specifically showing 1/2 ready containers.
Here is how I approached troubleshooting this like a Senior DevOps Engineer, and how you can fix it in your own clusters.
Step 1: Understanding the "1/2" State
The biggest clue here isn't the word "Error"—it's the 1/2.
This tells us that there are two containers defined inside this single pod. One of the containers successfully started and is perfectly healthy (the 1), but the second container is the one crashing and causing the Error / CrashLoopBackOff loop.
In modern Kubernetes architectures, running two containers in a pod usually means one of two things:
- An Init Container: A setup script that runs before the main app starts.
- A Sidecar Container: A helper container (like a database proxy, a logging agent, or an Istio/Linkerd mesh proxy) running alongside your main application.
Step 2: The Senior Engineer's Debugging Workflow
When faced with this, you shouldn't just guess or blindly restart the deployment. You need to ask Kubernetes for the evidence.
1. Identify the Crashing Container
First, we need to know the names of the two containers inside the pod. Run the describe command:
kubectl describe pod my-microservice-deployment-c6f985468-gmlc2Scroll down to the Containers: section. You will see two containers listed. Look at their State. One will say Running, and the other will say Waiting (Reason: CrashLoopBackOff) or Terminated (Reason: Error). Note the name of the failing container.
2. Check the Exit Code
While looking at the describe output, look at the Exit Code of the terminated container. This is a massive hint:
- Exit Code 1: Application error (a bug in the code, a missing configuration file, or a bad command).
- Exit Code 137: OOMKilled (Out of Memory). The container tried to use more RAM than its limits allowed, and the Linux kernel assassinated it.
- Exit Code 0: Normal exit. The process finished its job and shut down gracefully. (If a main container exits with 0, Kubernetes still restarts it because standard pods are expected to run forever).
3. Isolate the Logs
Normally, kubectl logs <pod-name> shows the logs. But because there are two containers, Kubernetes might complain or only show the healthy one. You must specify the exact name of the crashing container you found in Step 1:
kubectl logs my-microservice-deployment-c6f985468-gmlc2 -c <name-of-crashing-container>(Pro-Tip: If the container crashed so fast that the current logs are empty, append the --previous flag to see the logs from the previous failed attempt!)
kubectl logs my-microservice-deployment-c6f985468-gmlc2 -c <name-of-crashing-container> --previousCommon Causes and Fixes
Based on the logs and the Exit Code, here is how you resolve the most common culprits behind the 1/2 Error state:
Scenario A: The Sidecar Proxy is Failing (Network Issue)
If the failing container is a sidecar (like an Envoy proxy or Cloud SQL Auth Proxy), the Error is usually caused by misconfigured credentials or a bad connection string.
The Fix: Verify that the sidecar has the correct Kubernetes Secrets mounted and that the IAM permissions or database credentials are valid.
Scenario B: The Main App is Missing a Dependency
If the sidecar is healthy (e.g., the proxy started successfully) but your main application container is the one crashing, it often means your app tried to connect to a database or external API that wasn't ready yet.
The Fix: Implement a retry/backoff logic directly in your application code. Alternatively, use an InitContainer to ping the database; the main container will only start once the InitContainer successfully connects.
Scenario C: Misconfigured Liveness Probes
Sometimes the app is actually running fine, but it takes 60 seconds to boot up. If your Kubernetes livenessProbe is configured to check the app after only 10 seconds, Kubernetes assumes the app is broken and kills it, triggering the Error and CrashLoopBackOff.
The Fix: Increase the initialDelaySeconds in your deployment YAML, or better yet, use a startupProbe (designed specifically for slow-starting legacy applications).
Conclusion
A CrashLoopBackOff accompanied by an Error state is Kubernetes working exactly as designed—it is protecting the cluster from a faulty process. By systematically breaking down the pod using kubectl describe and isolating the container logs, you can quickly move past the scary status messages and directly address the root cause.